> For the complete documentation index, see [llms.txt](https://doc.dastra.eu/llms.txt). Markdown versions of documentation pages are available by appending `.md` to page URLs; this page is available as [Markdown](https://doc.dastra.eu/en/features/settings/siem-streaming.md).
# SIEM streaming
Stream your account's security audit events to your SIEM in real time
### What is it?
SIEM streaming forwards your Dastra account's **security audit events to your SIEM in real time**: logins, permission changes, API keys, MFA and SSO changes, user and workspace deletions… Every audit event of the account is streamed, so your security team gets the complete trail in the tool they already monitor (Splunk, Sentinel, Sumo Logic, QRadar…).
Independently of streaming, the audit logs can also be **exported manually** in SIEM formats — see [Manual export](#manual-export-from-the-audit-logs) below.
### Prerequisites
* The **Enterprise plan** (Advanced security feature).
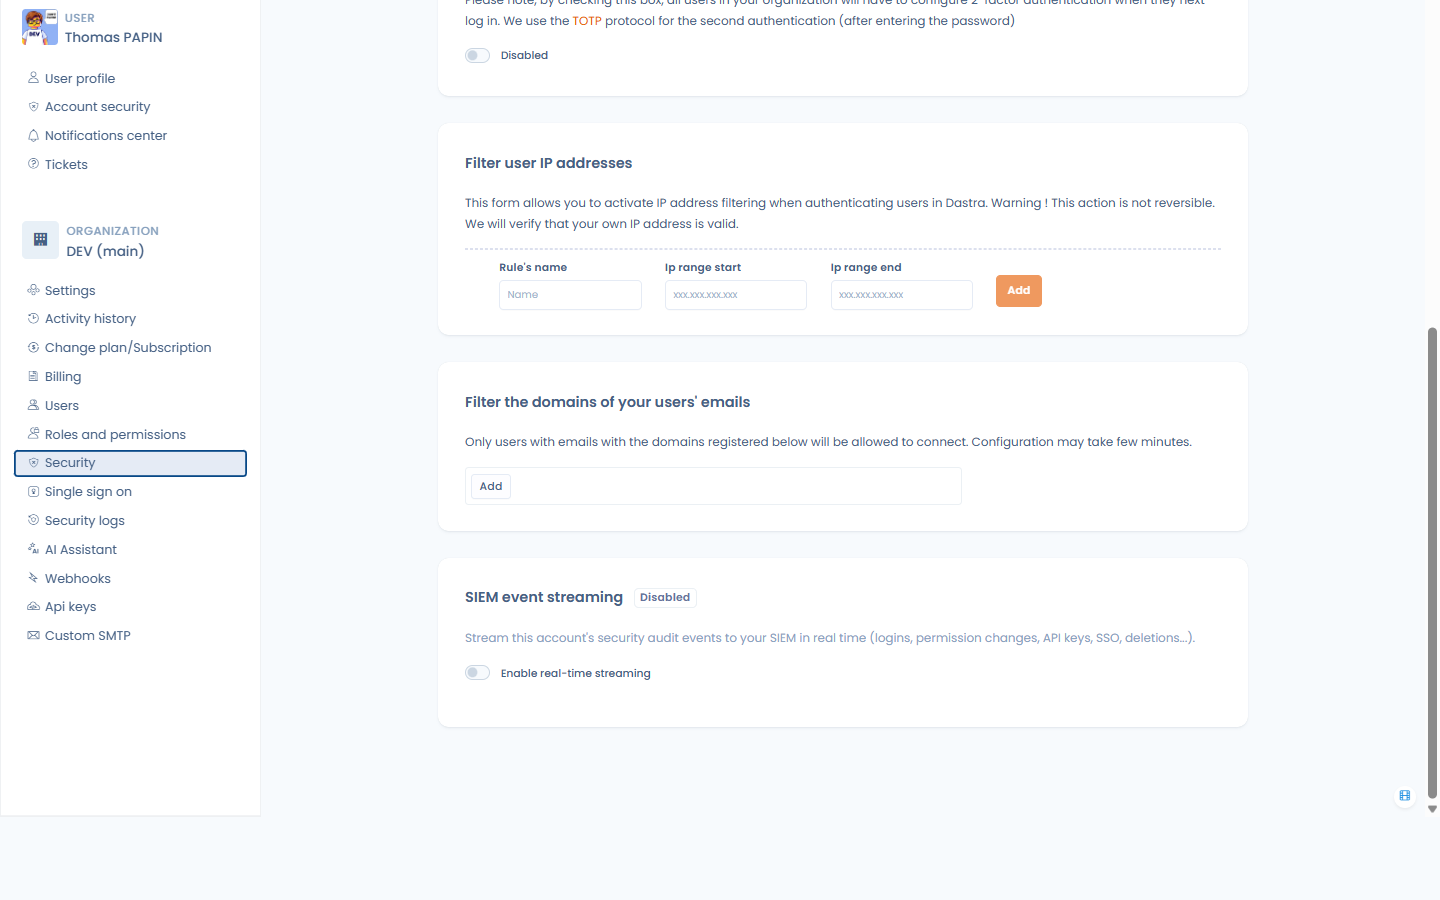
* You must be an **owner** of the account: the configuration lives in the **Security center**, at the bottom of the **Security** page (**SIEM event streaming** section).
* On the SIEM side: an HTTP event collector endpoint reachable over HTTPS (e.g. a Splunk HEC endpoint) and its token or API key.
The SIEM event streaming section, in Security center > Security
### Configuration
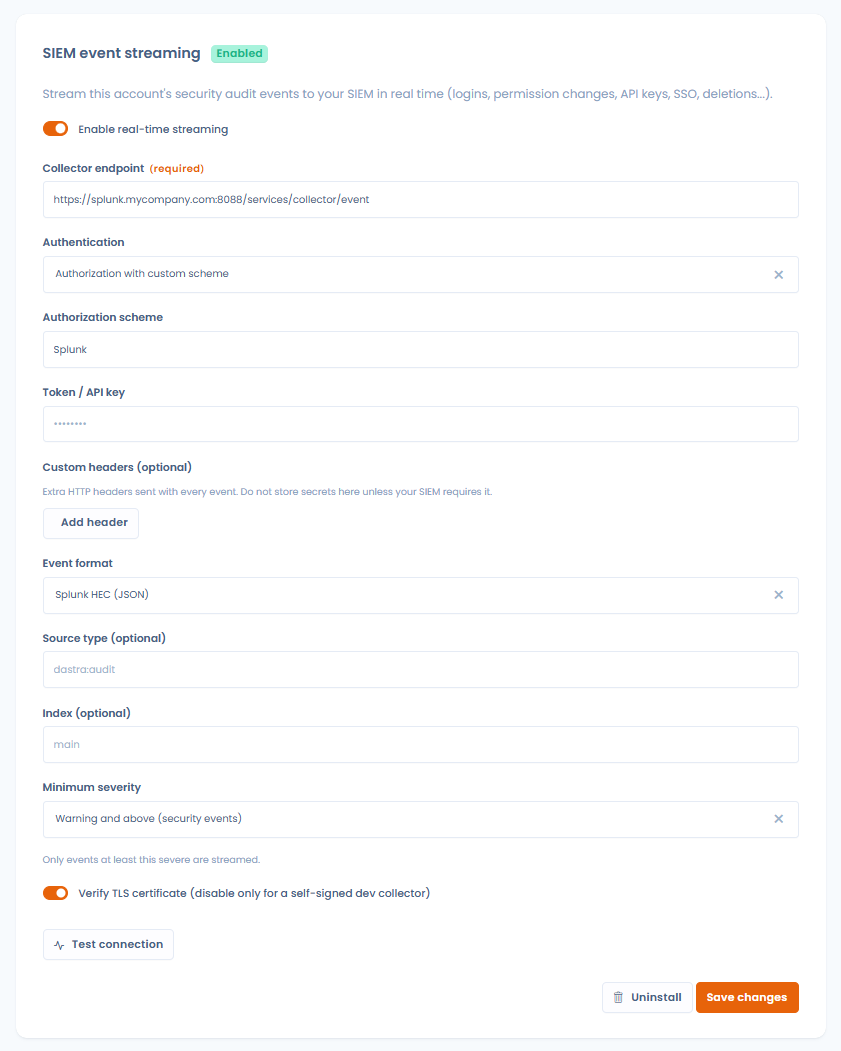
Fill in the form and click **Save**:
* **Collector endpoint** (required) — the HTTP(S) URL of your SIEM collector, e.g. `https://collector.example.com/services/collector/event` for Splunk HEC.
* **Authentication** — how the token is sent with each event:
* **Bearer** — `Authorization: Bearer ` (default),
* **API Key** — `Authorization: ApiKey `,
* **Authorization with custom scheme** — `Authorization: `, where you provide the **Authorization scheme** word (e.g. `Splunk` for a Splunk HEC input, `Api-Token` for Dynatrace),
* **Custom header** — the token is sent in the header you name in **Header name** (e.g. `X-API-Key`),
* **None** — no authentication header (e.g. when the token is part of the URL).
* **Token / API key** — the collector token. It is stored encrypted and never displayed again; leave the field empty later to keep the current one.
* **Custom headers (optional)** — extra HTTP headers sent with every event, as key/value pairs.
* **Event format**:
* **Splunk HEC (JSON)** — the native Splunk HTTP Event Collector envelope. Two extra optional fields appear: **Source type** (default `dastra:audit`) and **Index**.
* **Dynatrace (Log Monitoring v2)** — the native payload of the Dynatrace log ingest API.
* **CEF (Common Event Format)** — for ArcSight, Sumo Logic, and most SIEMs that ingest CEF.
* **Syslog (RFC 5424)** — structured syslog lines.
* **Minimum severity** — the least severe level that is still streamed: **All events**, **Notice and above**, **Warning and above (security events)** or **Error and above**. The default — and recommended — level is **Warning and above**: it keeps the security-relevant signal (failed logins, permission and SSO/MFA changes, API keys, deletions…) without flooding your SIEM with routine activity. Pick *All events* only if your SIEM must ingest the complete audit trail.
* **Verify TLS certificate** — keep it enabled; disable it only for a self-signed development collector.
Then switch on **Enable real-time streaming**.
{% hint style="info" %}
**Common recipes** — Splunk HEC: endpoint `https://:8088/services/collector/event`, format *Splunk HEC (JSON)*, authentication *Bearer* (or *Authorization with custom scheme* + `Splunk` for classic HEC inputs). Dynatrace: endpoint `https://.live.dynatrace.com/api/v2/logs/ingest`, format *Dynatrace (Log Monitoring v2)*, authentication *Authorization with custom scheme* + `Api-Token`.
{% endhint %}
Configuring SIEM streaming
### Testing the connection
**Test connection** sends a synthetic test event to your collector with the current form values and reports the outcome ("Test event delivered successfully", or the HTTP error returned by the collector). Use it after any change — the test does not require streaming to be enabled.
{% hint style="info" %}
The streaming applies to the whole account (all workspaces). One SIEM configuration exists per account.
{% endhint %}
### What is sent to the SIEM?
Each audit event is delivered individually, as it happens, with the following content:
| Field | Content |
| ------------------------------------------------------- | --------------------------------------------------------------- |
| `id` | Unique identifier of the audit event |
| `time` / `timestamp` | Event date (UTC) |
| `action` | Event type, e.g. `UserLogin`, `PermissionChange`, `ApiKeyAdded` |
| `message` | Human-readable description |
| `objectType` / `objectId` | The record involved, when applicable |
| `severity` | Syslog-style severity (see below) |
| `outcome` | `success` or `failure` |
| `actorId` / `actorName` / `actorEmail` | Who performed the action |
| `tenantId` / `workspaceId` / `workspaceName` / `areaId` | Where it happened |
| `url` | Deep link back to the record in Dastra |
Security-sensitive events are elevated in severity regardless of their display priority in Dastra: repeated failed logins are sent as **Error** (with `outcome: failure`); permission changes, API key creation/removal, MFA and SSO changes, user revocations and deletions, and workspace deletions are sent as **Warning**. This severity is also what the **Minimum severity** setting filters on — *Warning and above* (the recommended setting) restricts the stream to these security events.
{% hint style="info" %}
Events contain the actor's name and e-mail address — the information already shown in the Dastra audit log. No record content (personal data of data subjects, document contents…) is streamed.
{% endhint %}
### Manual export from the audit logs
You can export the security audit trail on demand, in the same formats, without configuring streaming:
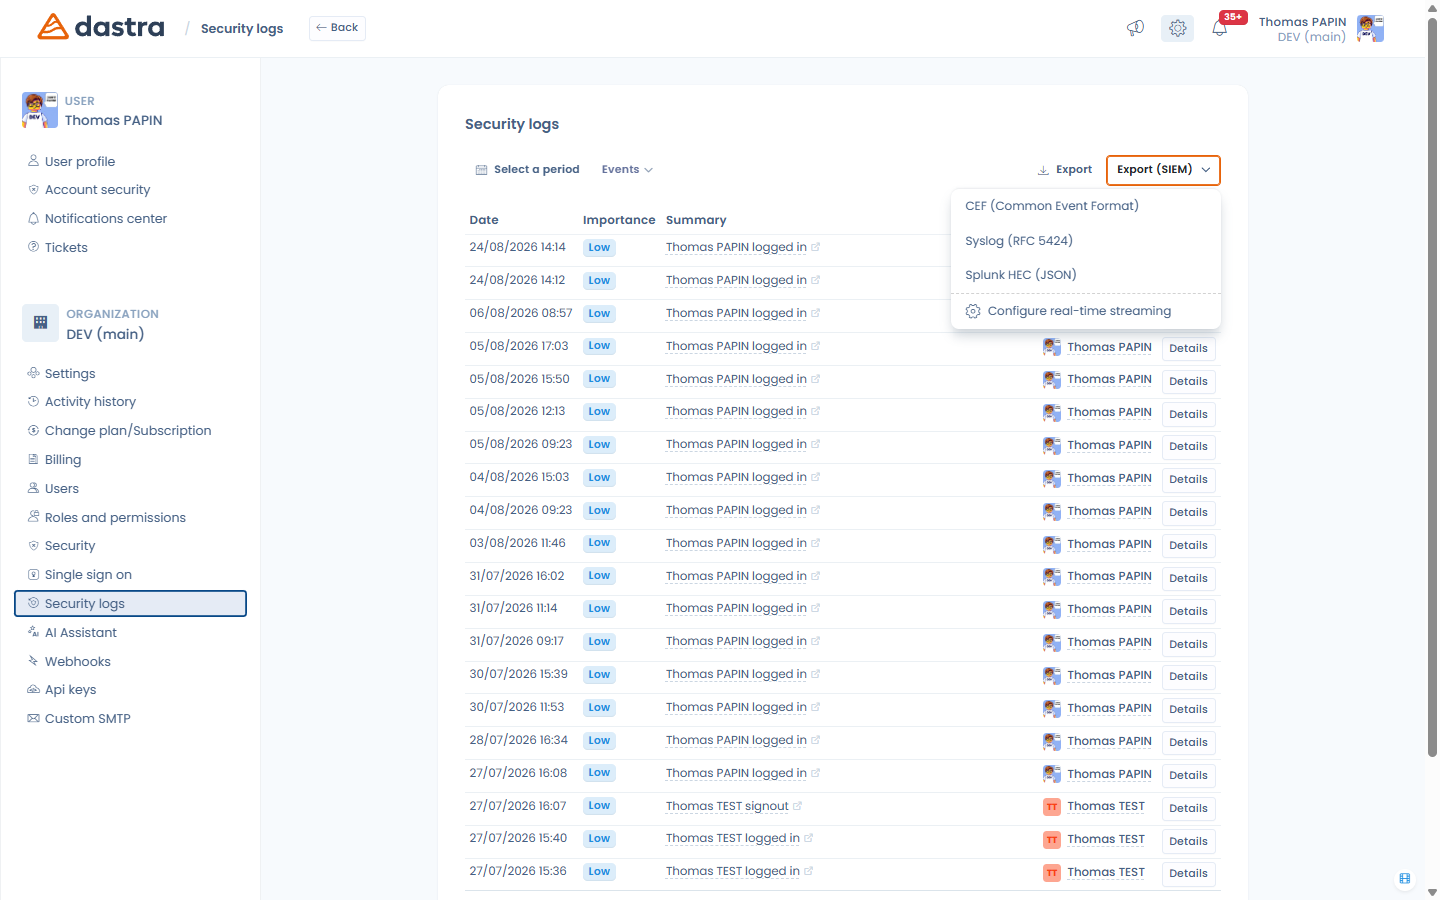
1. Open **Security center > Security logs**.
2. Set the filters (period, workspace…) as needed.
3. Open the **Export (SIEM)** dropdown next to the regular Export button and pick **CEF (Common Event Format)**, **Syslog (RFC 5424)** or **Splunk HEC (JSON)**.
The file (`dastra-security-logs-`) contains the matching audit events, up to 100 000, ready to be ingested by your SIEM.
The same dropdown also offers **Configure real-time streaming**, a shortcut to the streaming configuration described above.
One-off SIEM export from the security logs
### Troubleshooting
* **Test failed: HTTP 401/403** — check the token and the authentication scheme expected by your collector (Splunk HEC expects the token as configured on the HEC input; some collectors expect a custom header).
* **Test failed: certificate errors** — your collector uses a certificate Dastra cannot verify. Fix the certificate chain; only disable **Verify TLS certificate** for a development collector.
* **No events arriving** — make sure **Enable real-time streaming** is on, and check your collector's ingestion logs. Use **Test connection** to isolate connectivity from configuration.
---
# Agent Instructions
This documentation is published with GitBook. GitBook is the documentation platform designed so that both humans and AI agents can read, navigate, and reason over technical content effectively. Learn more at gitbook.com.
## Querying This Documentation
If you need additional information that is not directly available in this page, you can query the documentation by asking a question.
Perform an HTTP GET request on the following URL with the `ask` and `goal` query parameters:
```
GET https://doc.dastra.eu/en/features/settings/siem-streaming.md?ask=&goal=
```
`ask` is the immediate question: it should be specific, self-contained, and written in natural language.
`goal` is what the user is ultimately trying to achieve, the reason they need the answer. Sharing it helps GitBook give you a better, more relevant answer. A goal is most helpful when it describes the outcome the user wants rather than restating the question. For example, with `ask=how do I create an API token`, a goal like `automate deployments from our CI pipeline` lets GitBook tailor the answer to that use case.
The response will contain a direct answer to the question and relevant excerpts and sources from the documentation.
Use this mechanism when the answer is not explicitly present in the current page, you need clarification or additional context, or you want to retrieve related documentation sections.