> For the complete documentation index, see [llms.txt](https://doc.dastra.eu/llms.txt). Markdown versions of documentation pages are available by appending `.md` to page URLs; this page is available as [Markdown](https://doc.dastra.eu/en/features/reports.md).

# Custom reports

Create custom reports from Dastra data: tables, metrics, dimensions, filters, charts, exports and sharing.

Custom reports extract the information you need from Dastra data, in the form you choose: table, chart or export.

## Quick start

1. In the left menu, under **Resources**, click **Reporting**.
2. Reports are organized in categories. Before you create your first report, you need to **create a first category** with **Create Category**.
3. Click **Create Report** to build a blank report, or open the arrow of the button and choose **Create from library...**.

If AI analysis is included in your subscription, the AI button next to **Create Report** (**Generate a custom report with AI**) generates a report from a short description, for example "Number of data processing per workflow step with a chart".

## Glossary

* **Metric**: a measurable value used to group (aggregate) items. *Example: the number of processing activities, the average processing time of a task, etc.*
* **Dimension**: unlike a metric, a dimension does not aggregate data. It is a simple property (a column) of an item. *Example: the processing activity name, its status, its reference, etc.*

## Report construction

A report is built in four steps:

1. **Data selection**: choose the tables you want to query, then the relevant metrics and dimensions.
2. **Filters**: refine your results with criteria to keep only the data relevant to your analysis.
3. **Chart**: display the report as a chart or a table.
4. **Export and sharing**: export the report as PDF, Word, HTML, Excel, CSV, JSON or Markdown, share it, or connect it to a BI tool such as Power BI.

### Table selection

First choose the root table in the **Select the Root Table** list: it is the main table of the report, for example processing activities. Then click **Add Table** to add tables linked to the root table (processing steps, purpose, tags, etc.). You can query up to 7 tables in each report, the root table included.

<figure><img src="https://2697025545-files.gitbook.io/~/files/v0/b/gitbook-x-prod.appspot.com/o/spaces%2F-LvBxs22wUMicv9uWp6C-1972196547%2Fuploads%2Fgit-blob-508832dd7b5b75335b2b41c7c9d4c216bc44f1b5%2Freports-1.png?alt=media" alt="The selection of the root table and the linked tables"><figcaption><p>The selection of the root table and the linked tables</p></figcaption></figure>

Click **Next** when you have chosen the tables.

{% hint style="info" %}
You can go back to the table selection from the report builder, with the **Edit** button of the **Selected Tables** card, to add more tables. The tables already used by the report are locked.
{% endhint %}

### Building with metrics and dimensions

Build your report by dragging the metrics and dimensions you want, or by selecting them, from the left panel to the **Drop Metrics and Dimensions Here** area. A message warns you when you have reached the maximum number of metrics and dimensions for a report.

<figure><img src="https://2697025545-files.gitbook.io/~/files/v0/b/gitbook-x-prod.appspot.com/o/spaces%2F-LvBxs22wUMicv9uWp6C-1972196547%2Fuploads%2Fgit-blob-3e4aa9acec61a38255b45c515a47af3931c95c2d%2Freports-2.png?alt=media" alt="The metrics and dimensions editor"><figcaption><p>The metrics and dimensions editor</p></figcaption></figure>

The **Filters** card limits the data, and **Sort By** sets the order of the rows (tick **Ascending order** for an ascending sort). **Refresh Data** updates the preview.

Click **Save and continue** to open the report, or **Save changes** to stay in the editor.

{% hint style="info" %}
Data is automatically aggregated by dimension to calculate the selected metrics.
{% endhint %}

Example: if you select the metric **Number of Data processing** and the dimension **Status**, you get a report grouped as follows:

| Status | Number of Data processing |
| ------ | ------------------------- |
| Draft  | 12                        |
| Active | 560                       |

### Link to the record

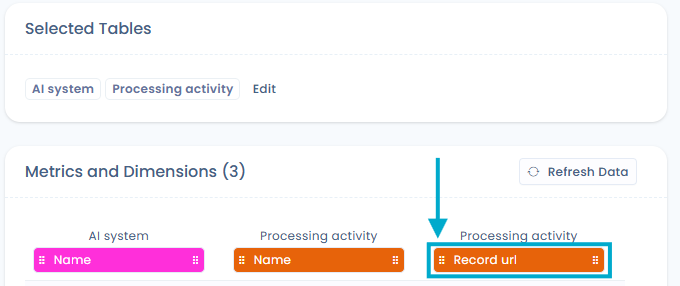
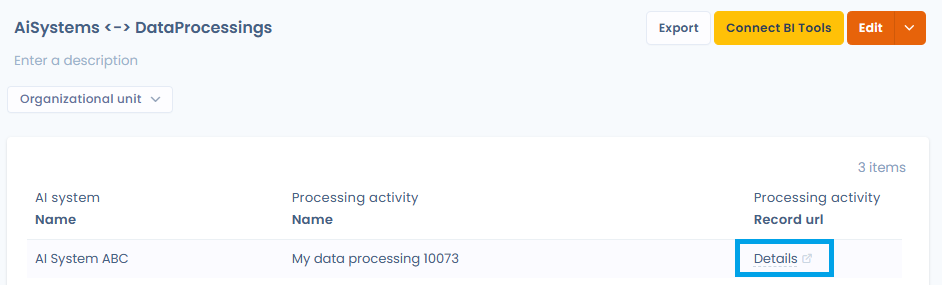
For tables of objects that have a record (processing activities, data subject requests, data breaches, assets, stakeholders, audits, security measures, contracts, AI systems and tasks), the **Record url** dimension adds a clickable **Details** link to each row. This link opens the record of the object in the right module, in a new tab and for the current workspace. The column is also included in exports, as a URL.

<figure><img src="https://2697025545-files.gitbook.io/~/files/v0/b/gitbook-x-prod.appspot.com/o/spaces%2F-LvBxs22wUMicv9uWp6C-1972196547%2Fuploads%2Fgit-blob-eab4af9ef3129623e14a9ee5a42db4b435d92e6e%2Fcustom-report-record-url-dimension.png?alt=media" alt="Record url dimension in the report construction"><figcaption><p>Adding the Record url dimension to the report</p></figcaption></figure>

<figure><img src="https://2697025545-files.gitbook.io/~/files/v0/b/gitbook-x-prod.appspot.com/o/spaces%2F-LvBxs22wUMicv9uWp6C-1972196547%2Fuploads%2Fgit-blob-5f1846717440dafe94a1a5116df2a383ee6c24bd%2Fcustom-report-details-link.png?alt=media" alt="Clickable Details link in a custom report"><figcaption><p>Each row shows a Details link that opens the record of the object</p></figcaption></figure>

## Display the report and add a chart

Once the report is saved, you land on its page. The data table is displayed with an organizational unit filter, **Reset filters** and the description of the report, which you can edit in place.

<figure><img src="https://2697025545-files.gitbook.io/~/files/v0/b/gitbook-x-prod.appspot.com/o/spaces%2F-LvBxs22wUMicv9uWp6C-1972196547%2Fuploads%2Fgit-blob-b570b52fe16895a7430a3b6d75829148aae6f986%2Freports-3.png?alt=media" alt="A custom report with its data table"><figcaption><p>The page of a custom report</p></figcaption></figure>

To add a chart, click **Add Chart**, then set the options:

* **Chart Type**: **Column Chart**, **Bar Chart**, **Pie Chart** or **Heatmap**.
* **Displayed Metric**: the value measured by the chart.
* **Dimension #1** and **Dimension #2**: the axes of the chart.
* **Data Stacking**: **Default**, **Stacking in Column** (stacked values) or **Stacking by Percentage** (stacked to 100%).
* **Sort By** and **Ascending order**: the display order.

The preview updates as you make your choices. To change or remove the chart later, use **Edit Chart** or **Remove Chart** above the chart.

<figure><img src="https://2697025545-files.gitbook.io/~/files/v0/b/gitbook-x-prod.appspot.com/o/spaces%2F-LvBxs22wUMicv9uWp6C-1972196547%2Fuploads%2Fgit-blob-9680c7d4d5eddb5b22e9e80cdd804b2536d8b518%2Freports-4.png?alt=media" alt="The Add Chart window with its options"><figcaption><p>The Add Chart window</p></figcaption></figure>

## Print, export and share

From the page of a report:

* **Export** downloads the report as CSV, Excel, JSON, PDF, Word, HTML or Markdown.
* The menu of the **Edit** button offers **Print**, **Export**, **Share** (reserved for users with the **Advanced configuration** permission) and **Move to recycle bin**.
* **Connect BI Tools** connects the report to a data analysis tool: see [Integration with data analysis tools (BI)](https://doc.dastra.eu/en/features/reports/bi-tools.md).

## Recycle bin

A deleted report or category first goes to the recycle bin: you can restore it as long as it has not been permanently deleted.

* **Move an item to the recycle bin**: in the actions menu of a report, click **Move to recycle bin** and confirm. The actions menu of a category, in the left panel, offers the same action: the category and all its reports are moved to the recycle bin.
* **View the recycle bin**: turn on the **View recycle bin** option above the list of reports, or use the menu of the categories panel.
* **Restore**: from the recycle bin, **Restore** puts the item back in the active list. Restoring a category also restores the reports moved to the recycle bin with it; restoring a report whose category is in the recycle bin also restores that category.
* **Permanently delete**: from the recycle bin, **Delete** erases the item after confirmation. Deleting a category also deletes all its reports. This action cannot be undone.

{% hint style="info" %}
Recycle bin actions require the permission to edit custom reports.
{% endhint %}


---

# Agent Instructions
This documentation is published with GitBook. GitBook is the documentation platform designed so that both humans and AI agents can read, navigate, and reason over technical content effectively. Learn more at gitbook.com.

## Querying This Documentation
If you need additional information that is not directly available in this page, you can query the documentation by asking a question.

Perform an HTTP GET request on the following URL with the `ask` and `goal` query parameters:

```
GET https://doc.dastra.eu/en/features/reports.md?ask=<question>&goal=<user_goal>
```

`ask` is the immediate question: it should be specific, self-contained, and written in natural language.
`goal` is what the user is ultimately trying to achieve, the reason they need the answer. Sharing it helps GitBook give you a better, more relevant answer. A goal is most helpful when it describes the outcome the user wants rather than restating the question. For example, with `ask=how do I create an API token`, a goal like `automate deployments from our CI pipeline` lets GitBook tailor the answer to that use case.

The response will contain a direct answer to the question and relevant excerpts and sources from the documentation.

Use this mechanism when the answer is not explicitly present in the current page, you need clarification or additional context, or you want to retrieve related documentation sections.