> For the complete documentation index, see [llms.txt](https://doc.dastra.eu/llms.txt). Markdown versions of documentation pages are available by appending `.md` to page URLs; this page is available as [Markdown](https://doc.dastra.eu/en/features/planifier/exportez-vos-taches.md).
# Monitor, screen or export your tasks
## Introduction

This makes it possible to monitor your processes and produce statistics with the help of KPIs in an agile mode, to ultimately demonstrate your company's accountability with regard to the GDPR.
## Task monitoring
#### Table tab
The columns tab displays a list of all tasks.

The view can be customised using the dedicated configuration interface ("filters" and "columns" buttons).
#### Column tab
The column tab provides access to a task overview that lets you view all tasks by status in a graphical way.

#### Progress chart
The progress chart summarises all the information about the progress made and the advancement of tasks over a given time frame.
This chart represents the evolution of the amount of work remaining for a given period (corresponding to an iteration).
#### Cumulative flow chart
This chart shows, over time, the distribution of tasks across the different life stages of a task.
#### Velocity chart
The velocity chart shows the evolution of the number of tasks closed per iteration.
You can filter tasks by priority, tags, departments, types, users or iterations directly from the filters available in each tab.

To export the tasks, go to the "column" or "table" tab of the "planning" module, then click the arrow on the right of the screen, then the "Export data" button.

A window appears with a choice of formats available for export. Click the format of your choice and then the "Download file" button.
A window appears with a choice of possible formats for export. Click on the format of your choice and then on the "Download file" button.
That's it, your tasks are exported!
{% embed url="" %}
## Custom views
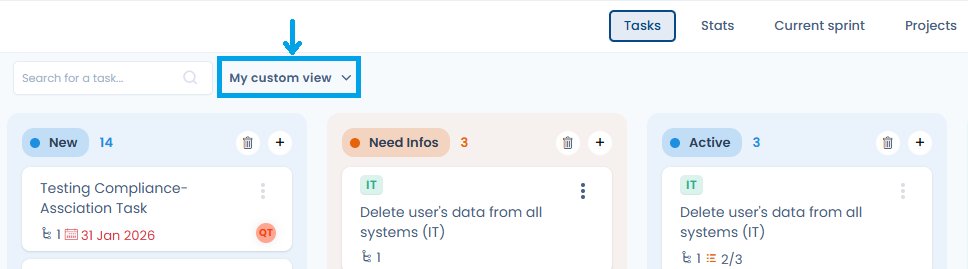
The Planning module supports **custom views**: you can save a combination of filters and columns under a name, then switch between your views with a single click from the toolbar.
The view selector appears in the toolbar — switch between saved views with a single click
### Creating a view
1. Apply the desired filters and column selection in the **Table** or **Columns** tab.
2. Click **Save view** in the toolbar.
3. Give your view a name and confirm.
The view appears directly in the toolbar for quick access.
### Sharing a view
You can **share a view** with other users in your workspace. Shared views appear under the **Shared views** section in the toolbar — handy for standardising action plan monitoring across a team.
### Example use cases
* "Overdue tasks" view: filter on tasks past their due date with status ≠ Closed
* "My backlog" view: filter on the logged-in user, status = To do, sorted by decreasing priority
* "Q3 Sprint" view: filter on the current iteration, all columns displayed
## Go further
{% content-ref url="/pages/xdLPrYI64RdQcWWFsWaP" %}
[Share as calendar](/en/features/planifier/share-as-calendar.md)
{% endcontent-ref %}
---
# Agent Instructions
This documentation is published with GitBook. GitBook is the documentation platform designed so that both humans and AI agents can read, navigate, and reason over technical content effectively. Learn more at gitbook.com.
## Querying This Documentation
If you need additional information that is not directly available in this page, you can query the documentation by asking a question.
Perform an HTTP GET request on the following URL with the `ask` and `goal` query parameters:
```
GET https://doc.dastra.eu/en/features/planifier/exportez-vos-taches.md?ask=&goal=
```
`ask` is the immediate question: it should be specific, self-contained, and written in natural language.
`goal` is what the user is ultimately trying to achieve, the reason they need the answer. Sharing it helps GitBook give you a better, more relevant answer. A goal is most helpful when it describes the outcome the user wants rather than restating the question. For example, with `ask=how do I create an API token`, a goal like `automate deployments from our CI pipeline` lets GitBook tailor the answer to that use case.
The response will contain a direct answer to the question and relevant excerpts and sources from the documentation.
Use this mechanism when the answer is not explicitly present in the current page, you need clarification or additional context, or you want to retrieve related documentation sections.